
[Free] Understand PostgreSQL EXPLAIN ANALYZE Plan
Most engineers run EXPLAIN ANALYZE. Lets learn how to read what it means.

Table of Contents
What We’re Working With
Query
Reading the Plan Line by Line
5 Numbers You Must Understand
What loops Really Means
Parallel Query Trap Why the Hints Didn’t Work
How to Calculate Actual Total Time
Checklist What to Look For in Every Plan
Skip the Guesswork → PostgreSQL Health Check
1. What We’re Working With
Before we touch the execution plan, let’s understand the table.
Table: test_compare_all_col_src1
Row count: 955,000
Columns: 14 (mix of integer, numeric, text, boolean, date/time types)
Row width: 97 bytes
Indexes: One a B-tree primary key on col_bigint
Access method: heap
This is a medium-sized table. ~955K rows at 97 bytes per row means roughly 88 MB of data on disk. Not huge, but enough that PostgreSQL will think carefully about how to read it.
Source: PostgreSQL: Re: Parallel hints in PostgreSQL with consistent perfromance
2. Query
EXPLAIN ANALYZE
SELECT /*+ PARALLEL(A 2) */ *
FROM test_compare_all_col_src1 A;
Table Schema:
Table Schema :


                                       Table "test_compare_all_col_src1"
     Column      |            Type             | Collation | Nullable |
Default | Storage  | Stats target | Description
-----------------+-----------------------------+-----------+----------+---------+----------+--------------+-------------
 col_smallint    | integer                     |           |          |
    | plain    |              |
 col_int         | integer                     |           |          |
    | plain    |              |
 col_bigint      | bigint                      |           | not null |
    | plain    |              |
 col_numeric     | numeric                     |           |          |
    | main     |              |
 col_real        | real                        |           |          |
    | plain    |              |
 col_double      | double precision            |           |          |
    | plain    |              |
 col_bool        | boolean                     |           |          |
    | plain    |              |
 col_char        | character(1)                |           |          |
    | extended |              |
 col_varchar     | character varying(2000)     |           |          |
    | extended |              |
 col_date        | date                        |           |          |
    | plain    |              |
 col_time        | time without time zone      |           |          |
    | plain    |              |
 col_timetz      | time with time zone         |           |          |
    | plain    |              |
 col_timestamp   | timestamp without time zone |           |          |
    | plain    |              |
 col_timestamptz | timestamp with time zone    |           |          |
    | plain    |              |
Indexes:
    "test_compare_all_col_src1_pkey" PRIMARY KEY, btree (col_bigint)
Replica Identity: FULL
Access method: heap
What’s happening here:
EXPLAIN ANALYZEdon’t just show me the plan, actually run the query and show real numbers/*+ PARALLEL(A 2) */this is a pg_hint_plan hint asking PostgreSQL to use 2 parallel workersSELECT *we’re reading every column from every row (a full table scan)
Now let's look at what PostgreSQL actually did.
3. Reading the Plan Line by Line
Here’s the raw output:
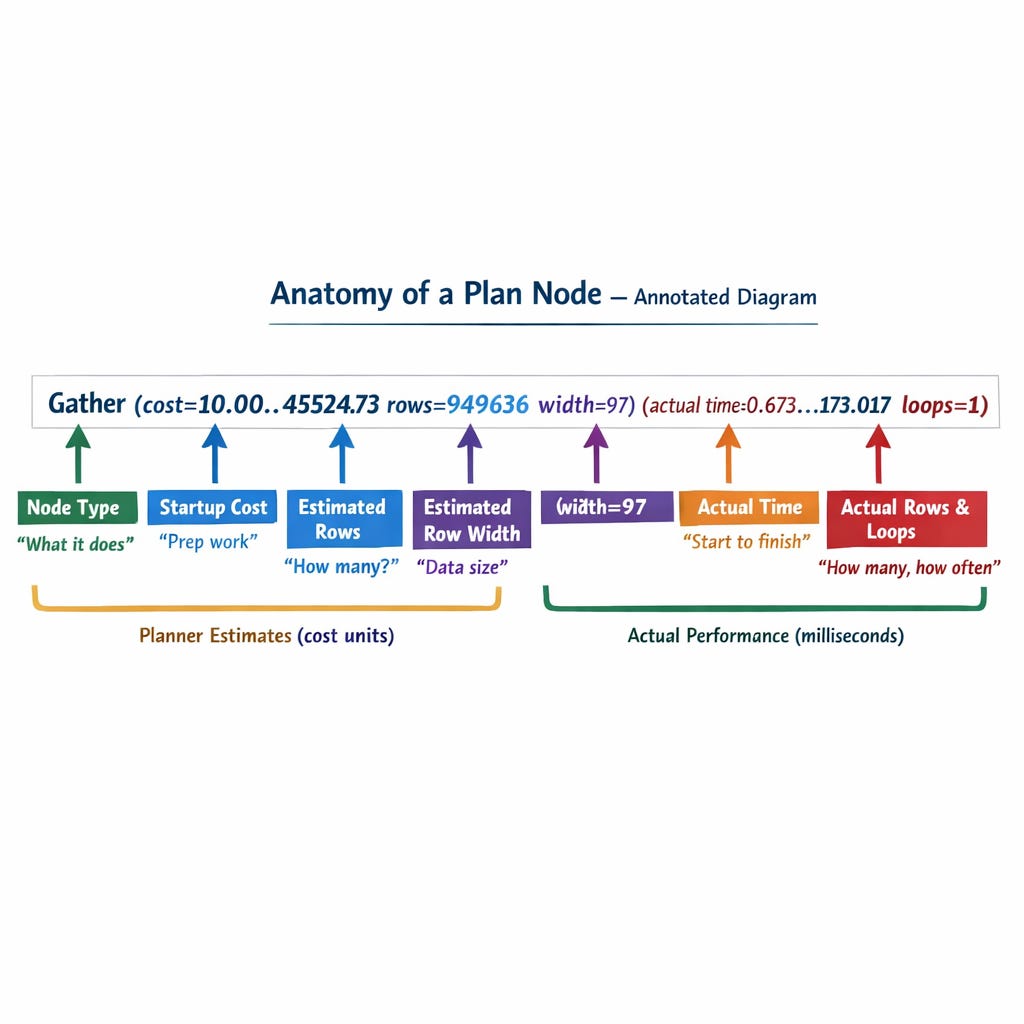
Gather  (cost=10.00..45524.73 rows=949636 width=97) (actual time=0.673..173.017 rows=955000 loops=1)
   Workers Planned: 4
   Workers Launched: 4
   ->  Parallel Seq Scan on test_compare_all_col_src1 a  (cost=0.00..44565.09 rows=237409 width=97) (actual time=0.039..51.941 rows=191000 loops=5)
 Planning Time: 0.093 ms
 Execution Time: 209.745 ms
Six lines. Let’s break every single one.
Line 1: Gather Node
Gather (cost=10.00..45524.73 rows=949636 width=97) (actual time=0.673..173.017 rows=955000 loops=1)Gather is the collector. It’s the leader process that waits for all parallel workers to finish and combines their results into one stream.
Think of it as a manager who split a job across 4 workers and is now collecting all finished work into one pile.
Now let’s unpack the numbers. Every node in a plan has two sets of parentheses:
First parenthesis the ESTIMATE (what the planner predicted):
cost=10.00..45524.7310.00= startup cost the work needed before the first row can be returned45524.73= total cost the estimated total work to return all rowsThese are in arbitrary cost units (not milliseconds). They’re relative useful for comparing plans, not for measuring wall-clock time.
rows=949636= the planner estimated this would return 949,636 rowswidth=97= each row is estimated at 97 bytes wide
Second parenthesis the ACTUAL (what really happened):
actual time=0.673..173.0170.673 ms= time to return the first row173.017 ms= time to return the last rowThese ARE real milliseconds.
rows=955000= it actually returned 955,000 rowsloops=1= this node executed once
What to notice:
Estimated rows: 949,636. Actual rows: 955,000. That’s about 0.5% off statistics are accurate. Good.
If the estimate was wildly off (e.g., estimated 1,000, actual 955,000), that would mean stale stats and bad plans.
Line 2–3: Workers Planned & Launched
Workers Planned: 4
Workers Launched: 4
Workers Planned: 4 the planner decided 4 parallel workers is optimal
Workers Launched: 4 all 4 actually started (sometimes the system can’t launch all of them if resources are tight)
Important: If Workers Launched < Workers Planned, it means the system was under resource pressure. All workers failing to launch degrades to a serial scan.
Total processes involved: 4 workers + 1 leader = 5 processes reading the table.
Line 4: Parallel Seq Scan Node
-> Parallel Seq Scan on test_compare_all_col_src1 a (cost=0.00..44565.09 rows=237409 width=97) (actual time=0.039..51.941 rows=191000 loops=5)This is the actual work. Each worker reads a portion of the table sequentially.
The -> arrow means this is a child node of the Gather above it.
Estimates:
cost=0.00..44565.09zero startup cost (just start reading), total cost ~44,565 unitsrows=237409estimated rows per worker (949,636 ÷ 4 workers ≈ 237,409)width=97same row width
Actuals:
actual time=0.039..51.941each loop took ~52msrows=191000each loop returned ~191,000 rowsloops=5this node ran 5 times (4 workers + 1 leader)
Here’s the critical calculation:
Total rows processed = rows × loops = 191,000 × 5 = 955,000 matches the actual table size.
Line 5–6: Planning & Execution Time
Planning Time: 0.093 ms
Execution Time: 209.745 ms
Planning Time: 0.093 ms PostgreSQL took 0.093ms to figure out the best plan. This is fast. For complex queries with many joins, this can be 10-50ms+.
Execution Time: 209.745 ms the total wall-clock time to actually run the query and return all 955K rows.
Note: Execution Time includes the Gather overhead (collecting results from workers), which is why it’s 209ms even though each worker only took ~52ms.
4. 5 Numbers You Must Understand
Every time you read an EXPLAIN plan, find these five:
Estimated rows vs Actual rows if they’re wildly different, run
ANALYZEStartup cost vs Total cost high startup cost means sorting/hashing before returning anything
Actual time (first row..last row) the real-world latency
Loops multiply rows and time by loops to get true totals
Execution Time the bottom-line wall-clock time
5. What loops Really Means
This is the most misunderstood number in EXPLAIN output.
When you see:
rows=191000 loops=5This does NOT mean 191,000 total rows. It means:
Each of the 5 loops processed 191,000 rows
Total rows = 191,000 × 5 = 955,000
Same applies to time:
actual time=0.039..51.941 loops=5Each loop took ~52ms
But they ran in parallel, so wall-clock time ≈ 52ms (not 52 × 5)
Rule of thumb:
Rows × Loops = total rows processed
Time × Loops = total CPU time (but if parallel, wall-clock is lower)
6. Parallel Query Trap Why the Hints Didn’t Work
Here’s the most interesting part of this case study.
Three queries were run with different parallelism hints:
/*+ PARALLEL(A 2) */— asked for 2 workers/*+ PARALLEL(A 4) */— asked for 4 workers/*+ PARALLEL(A 6) */— asked for 6 workers
The result for ALL THREE:
Workers Planned: 4
Workers Launched: 4
Execution Time: ~210ms, ~210ms, ~235ms
PostgreSQL ignored every hint. It used 4 workers every time.
Why?
There are several possible reasons:
pg_hint_plan extension may not be installed. Without it, PostgreSQL treats
/*+ ... */as a regular comment and silently ignores it.max_parallel_workers_per_gather may be set to 4. This is a hard cap. Even if you hint for 6, PostgreSQL won’t exceed this limit.
max_parallel_workers may also cap total parallel workers system-wide.
The planner decided 4 is optimal. PostgreSQL’s cost model considers table size, available CPUs, and
parallel_tuple_cost/parallel_setup_cost. It may have decided that 4 workers is the sweet spot for a 955K row table at 97 bytes wide.There´s a bug in pg_hint_plan
Lesson: Hints in PostgreSQL are not commands. They’re suggestions and often ignored. Always verify the plan.
Also notice: Asking for 6 workers (3rd query) was actually slower 235ms vs 210ms. More parallelism isn’t always better. Gather node overhead of combining results from more workers can outweigh the scan speed gains.
7. How to Calculate Actual Total Time
Here’s a formula that works for any EXPLAIN plan:
Wall-clock time = Execution Time (bottom of plan)

Per-worker time = actual time × loops (for CPU accounting)

Overhead = Execution Time - max(child node actual time)
For our query:
Execution Time:          209.745 ms
Parallel Seq Scan time:   51.941 ms × 5 loops = 259.7 ms total CPU
Gather overhead:          209.745 - 173.017 = 36.728 ms
The Gather node spent ~37ms collecting results from workers and assembling the final result set. That’s the tax of parallelism.
8. Checklist What to Look For in Every EXPLAIN Plan
Run through these every time you read a plan:
Scan type Seq Scan on a large table? Likely needs an index.
Estimated vs actual rows off by more than 10×? Run ANALYZE.
Loops are you multiplying rows × loops for the real count?
Nested Loop on large sets usually means a missing index on the inner table
Sort / Hash with high cost work_mem may be too low (spilling to disk)
Rows Removed by Filter large number means filtering after scanning; index could help
Bitmap Heap Scan with Recheck Cond work_mem too low for exact bitmap
Workers Planned vs Launched mismatch means resource pressure
Planning Time above 50ms? Query may have too many joins or partitions
Execution Time this is your bottom-line number. Measure against your SLA.
9. Skip the Guesswork
Reading one EXPLAIN plan teaches you. But your database has hundreds maybe thousands of active queries.
PostgreSQL Health Check runs 60+ diagnostic queries against your database and surfaces:
The top time-consuming queries
Missing and unused indexes
Table bloat, vacuum health, and stale statistics
Much more
Everything ranked by severity with specific fix recommendations
👉 [Get Your PostgreSQL Health Check →]
One report. 60+ queries. Every blind spot uncovered.
Enjoyed reading? Restack, share with your audience.