Major Update: PostgreSQL Health Report v2.0 Automate & Prevent Performance Issues
Prevent PostgreSQL outages, monitor 70+ critical metrics, and automate health checks with stored functions and SQL scripts.
Stop Being Surprised by Sev-1 Incidents
If you’ve ever been called for a PostgreSQL outage, you already know the painful truth: databases rarely fail suddenly they fail quietly first.
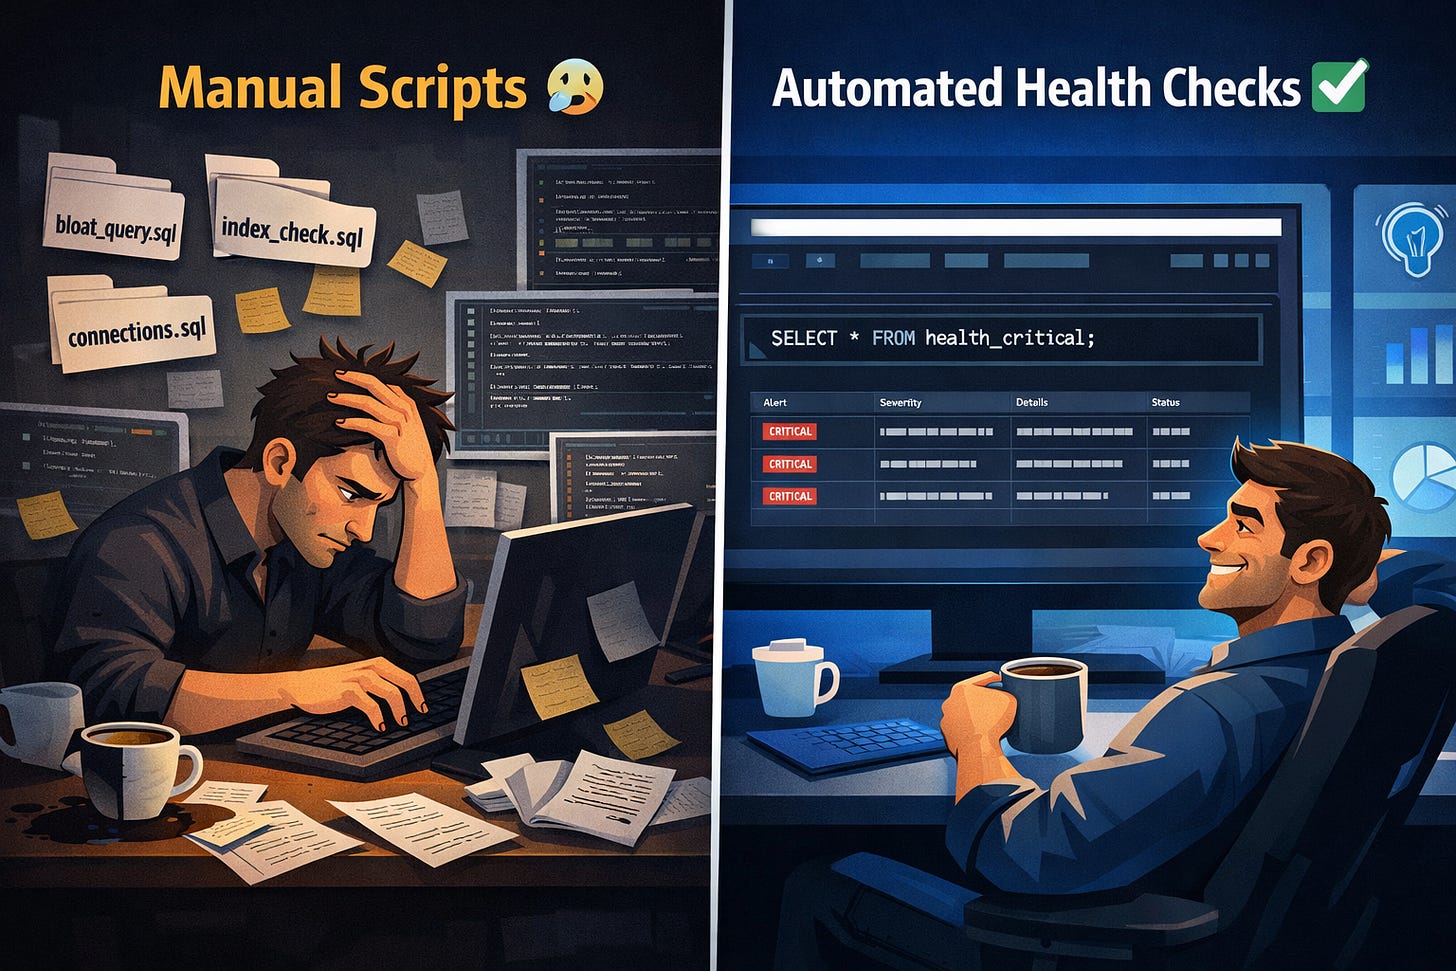
Most teams rely on a messy folder of SQL scripts for PostgreSQL health checks.
One script for bloat, another for indexes, another for connections. It works… until it doesn’t. During a Sev-1, manually running scripts and stitching results together is the last thing you want to do.
That’s why I built the PostgreSQL Health Report v2.0: a professional Postgres monitoring and health check automation tool built by DBAs, for DBAs.
What started as a standalone SQL script has now evolved into a stored function and view–based tool to automate monitoring, while still keeping the classic script for one-time checks.
Why Stored Functions Change Everything
In the original version, generating a report meant executing a massive SQL file every time you wanted a snapshot. While effective, it didn’t integrate well with alerting systems, schedulers, or long-term monitoring strategies.
With Version 2.0, the entire PostgreSQL health check is encapsulated inside the database using PostgreSQL stored function monitoring patterns that fit naturally into modern DBA automation tools.
Price: $29 – Includes 2 Files: 👉 [Buy the Updated PostgreSQL Health Report]
1. Install Once, Run Anywhere
Instead of copy-pasting thousands of lines of SQL across environments, installation is now a one-time operation:
-- One-time installation
\i install_health_report_function.sql
This creates the run_health_report(); stored function along with a set of supporting views. From that point on, health checks are always available no scripts, no manual prep.
2. Health can be queried using Views
Effective Postgres database monitoring should provide queryable access to relevant metrics and data, not hidden in logs or text output. Version 2.0 exposes health data through clean, purpose-built views:
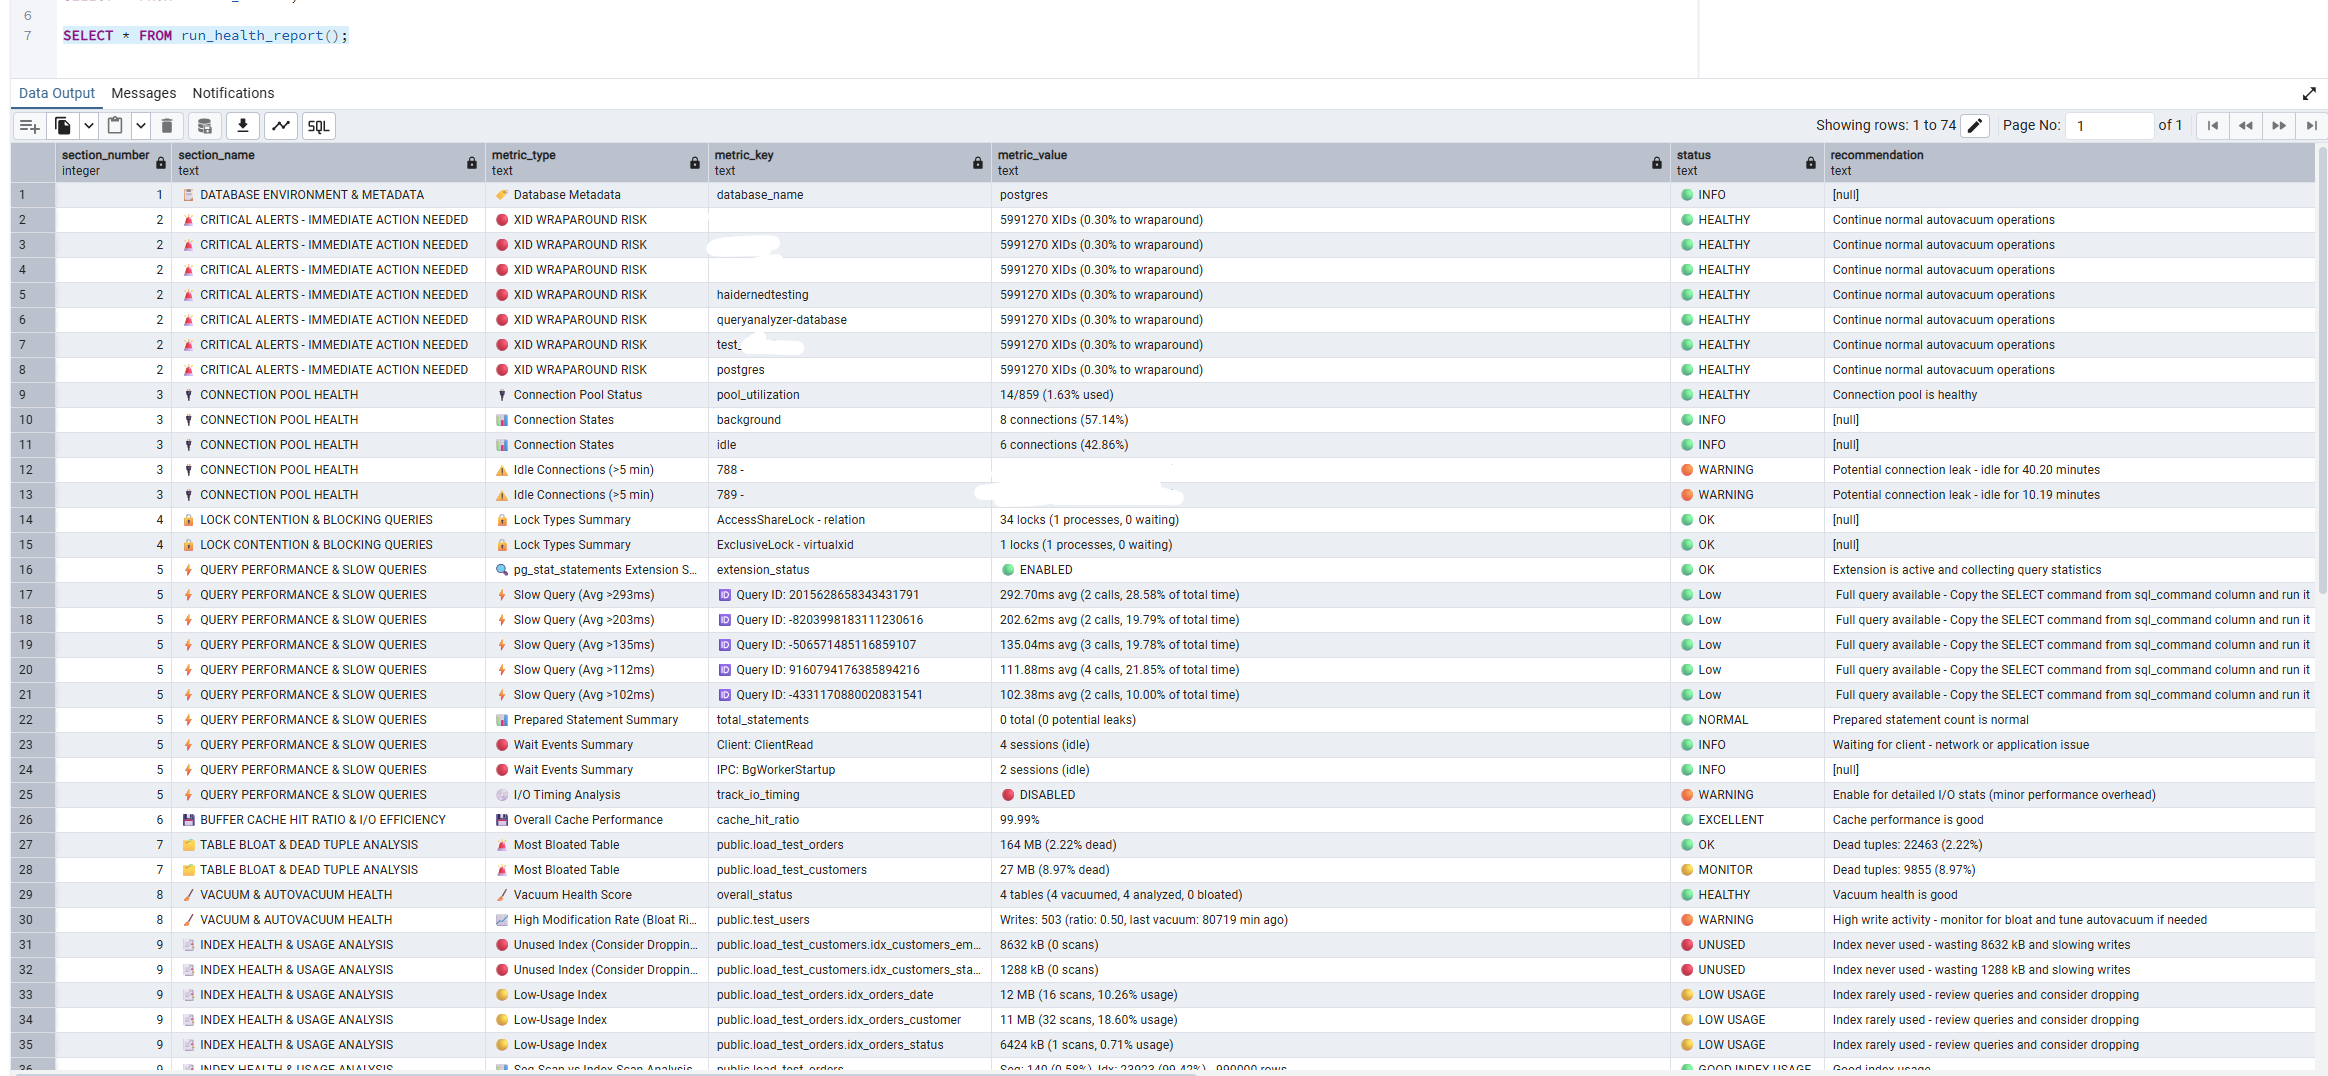
SELECT * FROM run_health_report();
This instantly returns a structured overview of critical checks autovacuum health, cache hit ratios, storage risks, configuration warnings making it easy to monitor PostgreSQL using views and functions.
Example:
Heads up: Personal data is hidden.
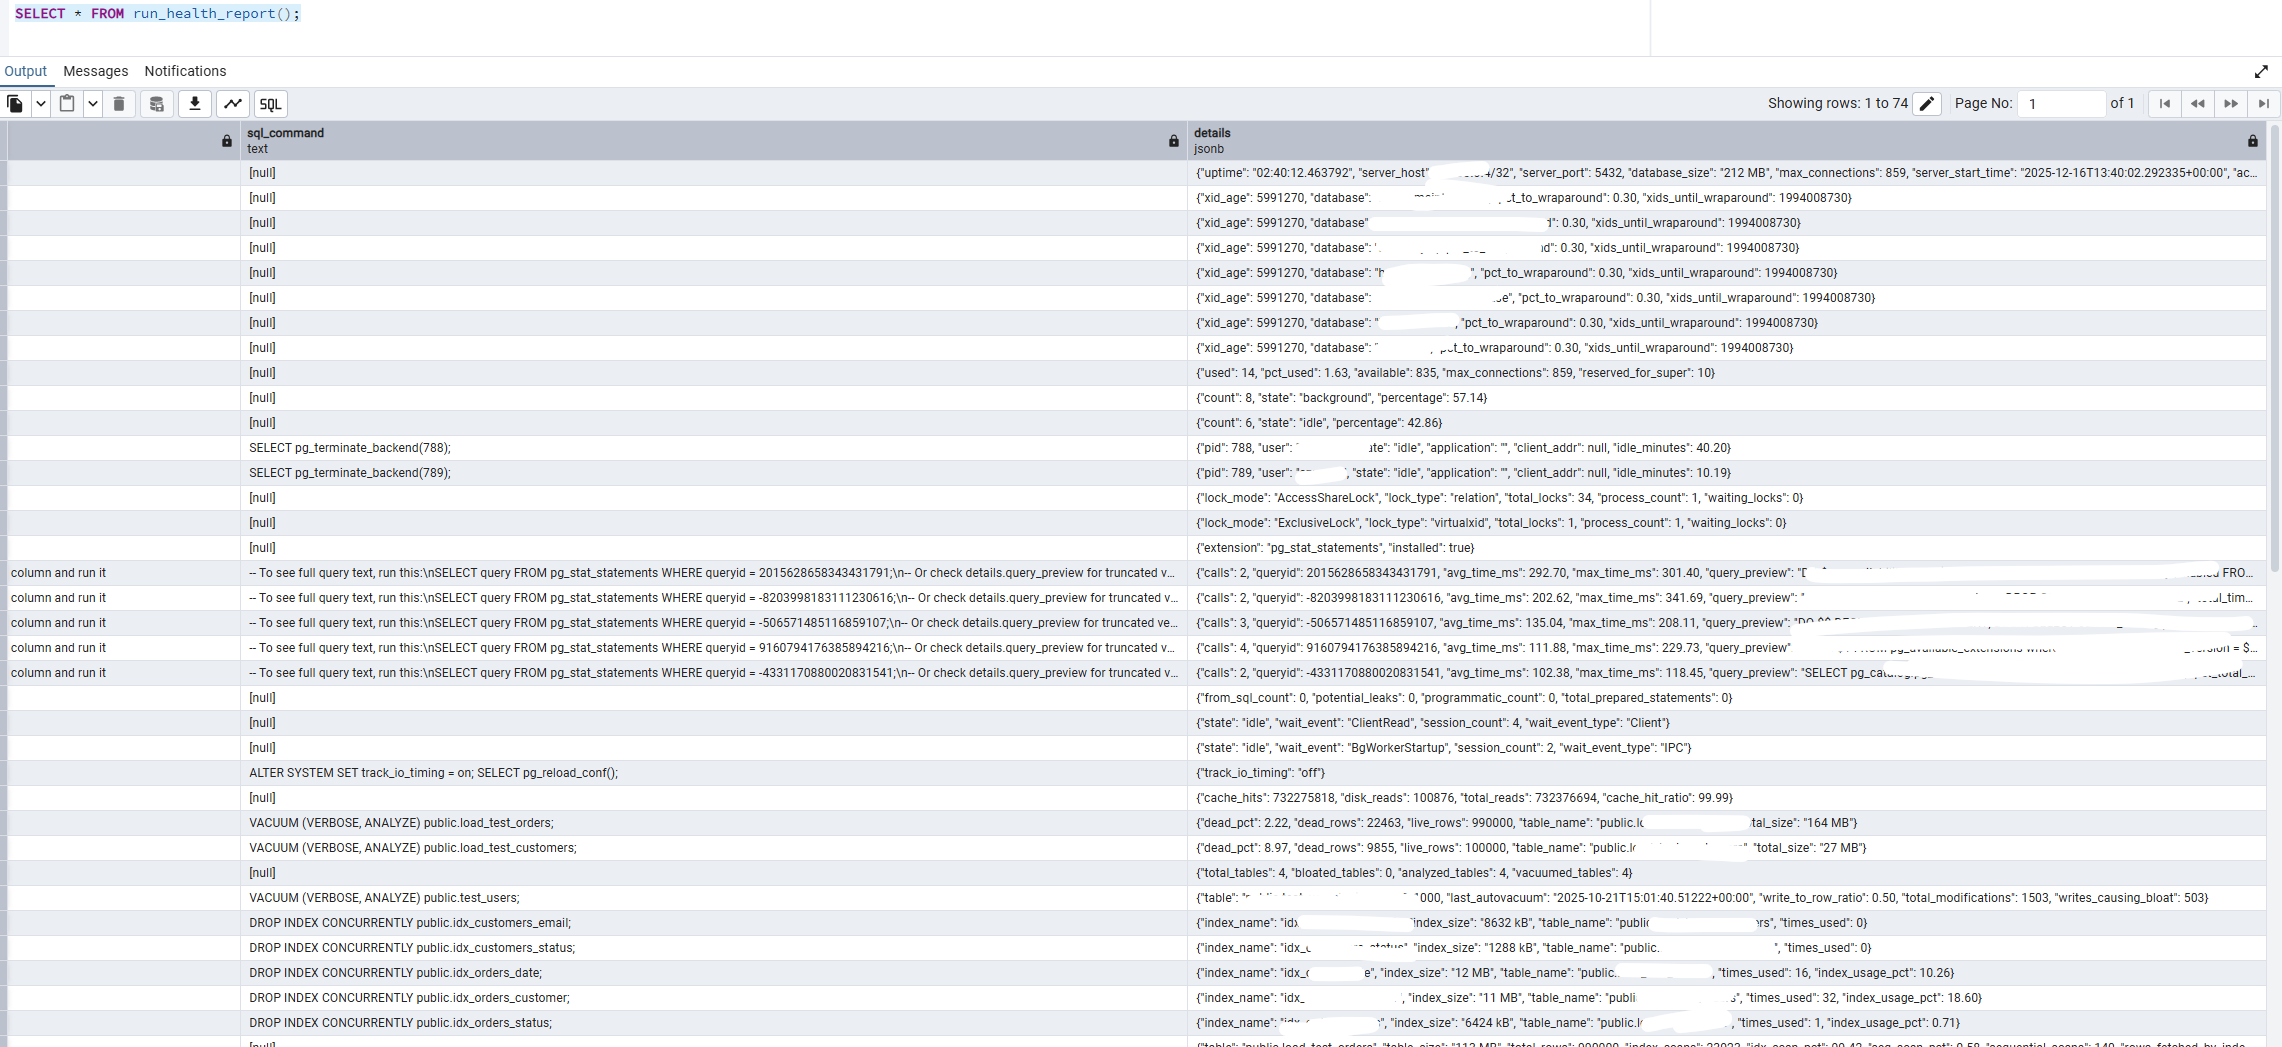
More details of first query output:
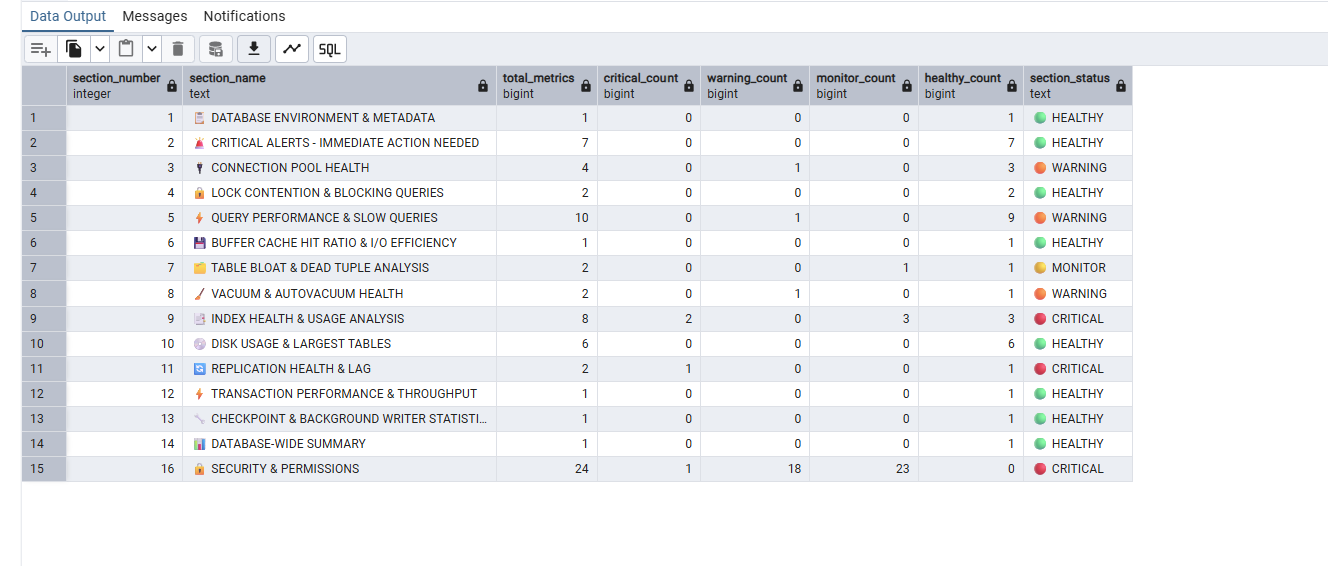
Want quick Health Summary? Run this, based on the section will give you section status.
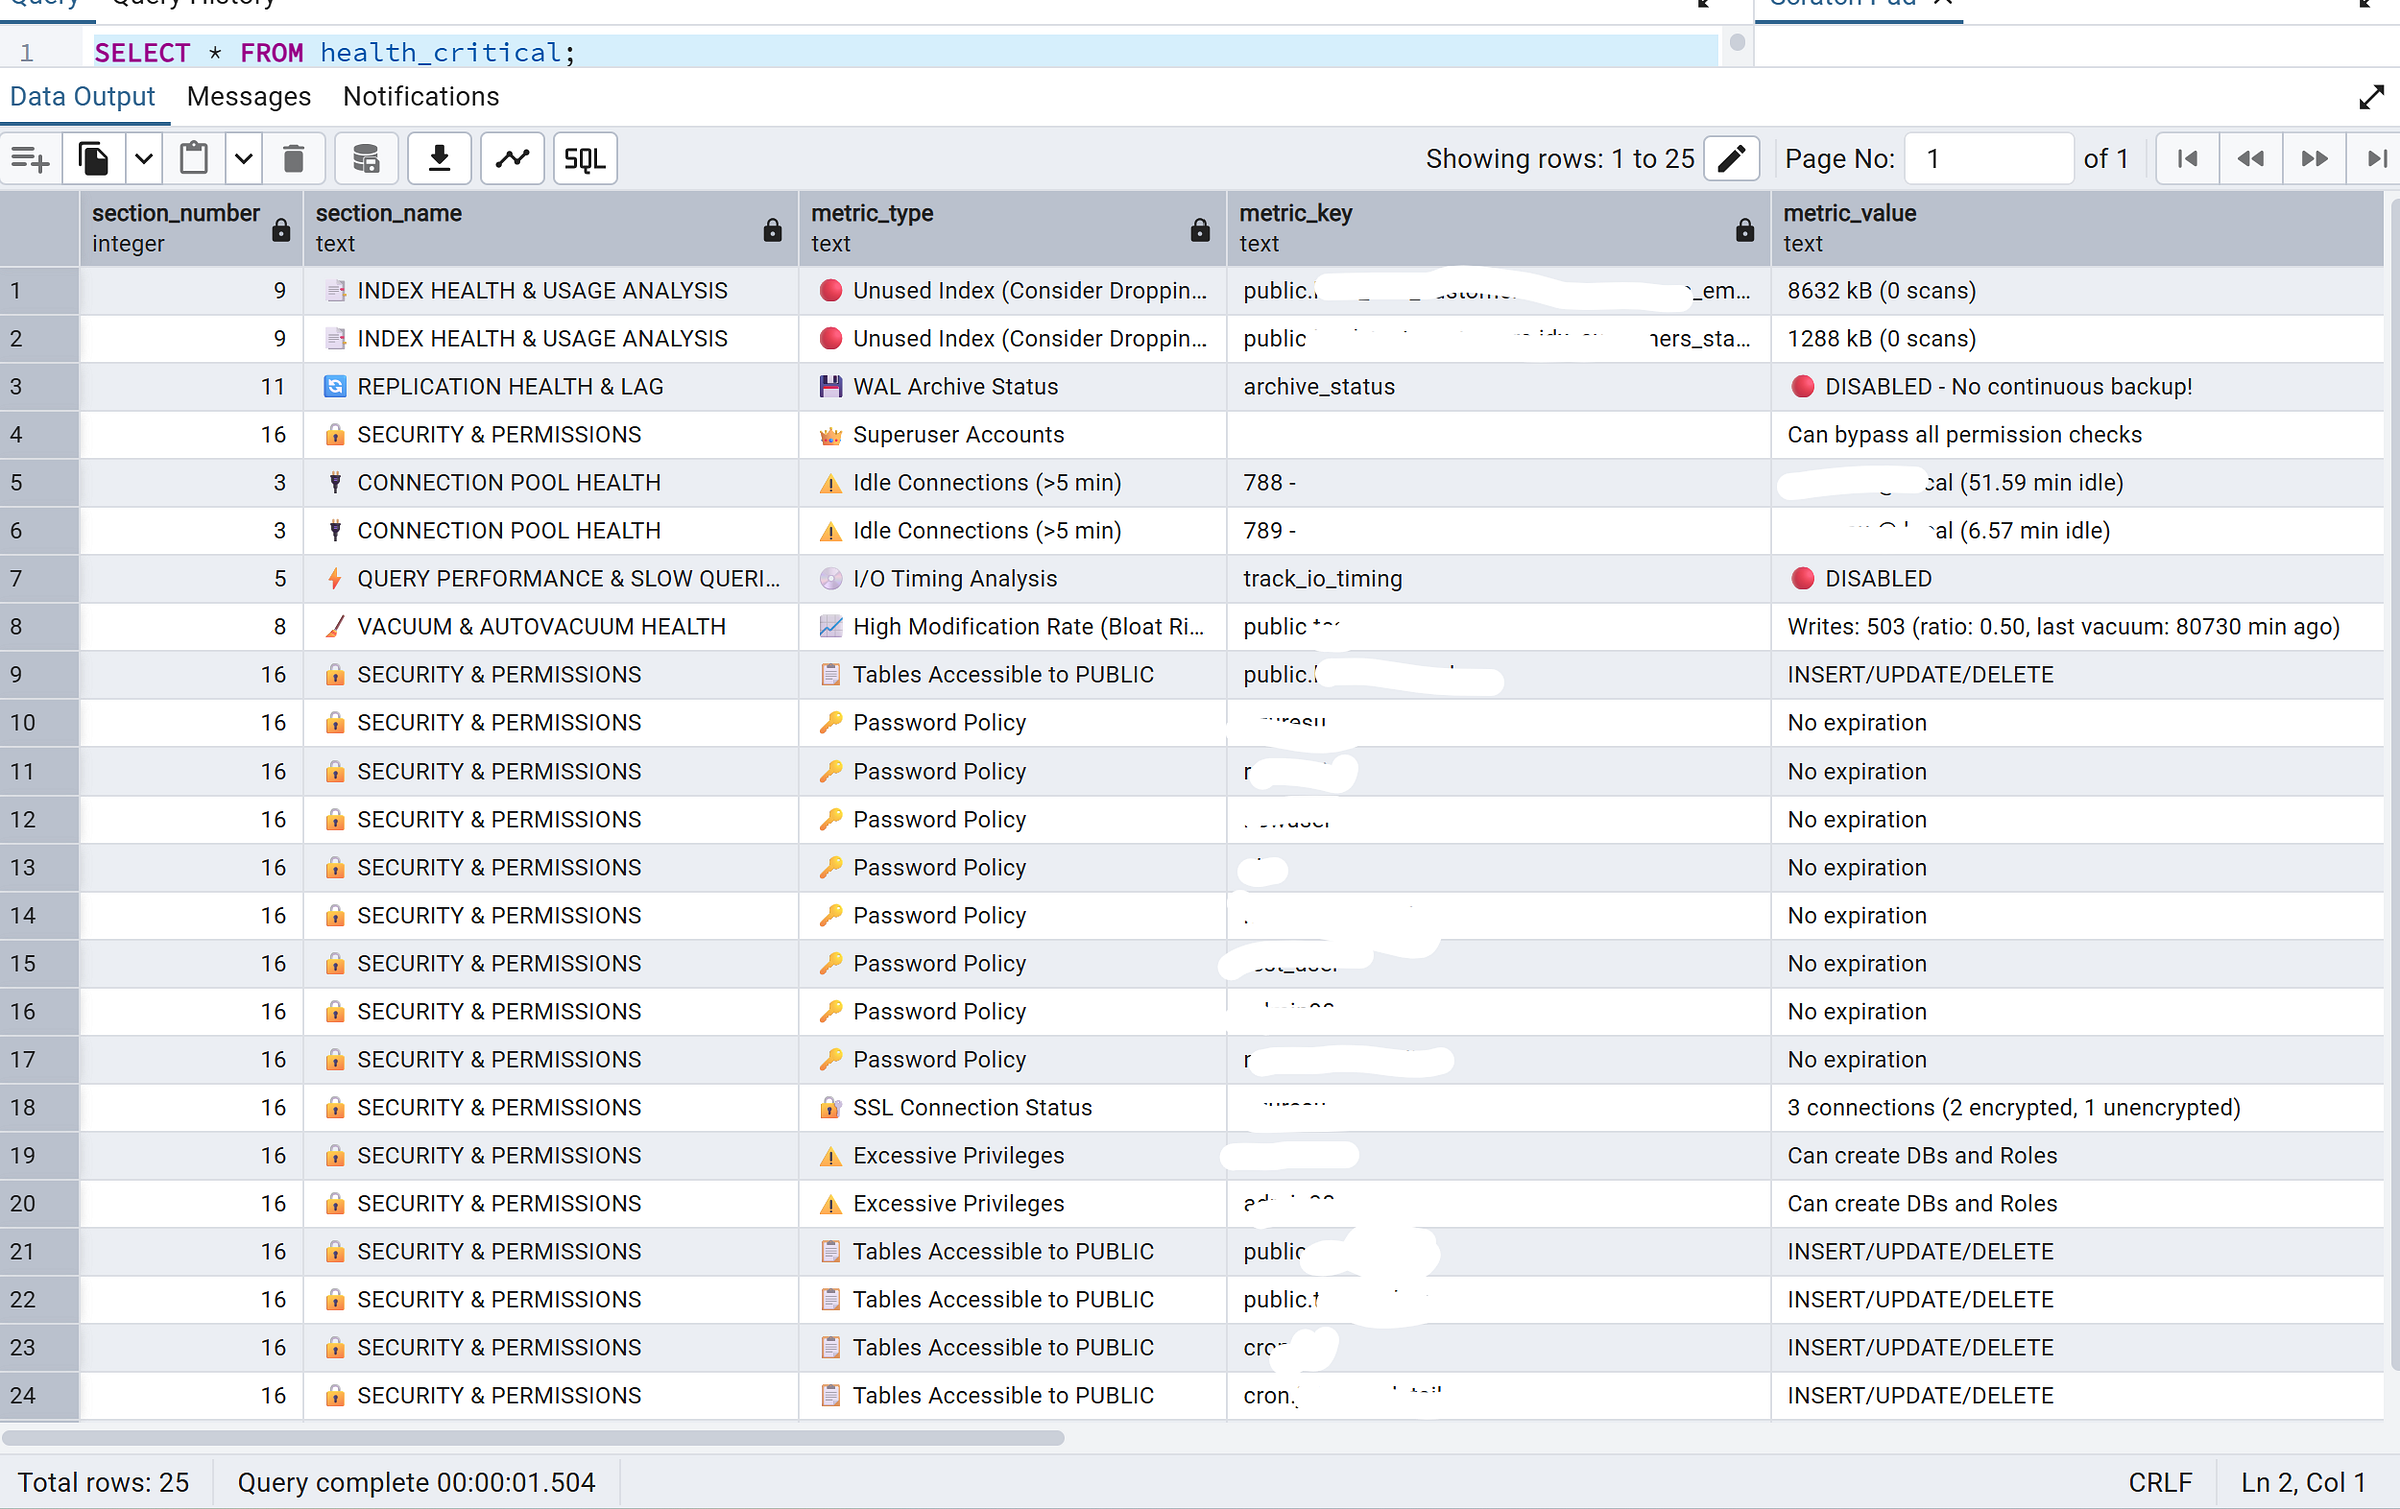
SELECT * FROM health_summary;Just want to check Critical:
SELECT * FROM health_critical;3. Real Automation for Real Incidents
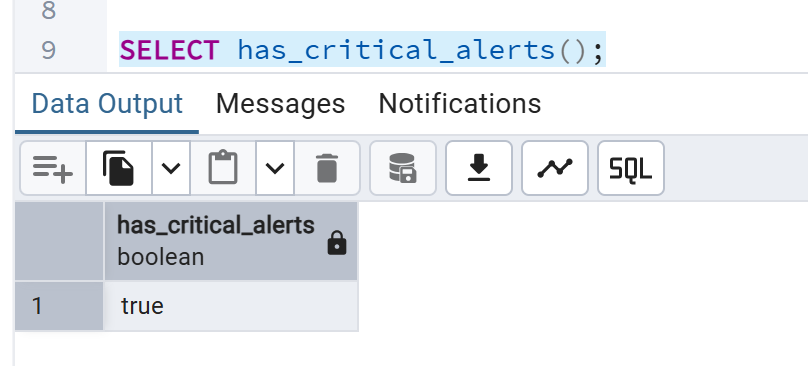
This is where Postgres health check automation becomes operationally useful. We’ve added a boolean helper function, has_critical_alerts(), specifically designed for monitoring systems like Nagios, Zabbix, Datadog, or custom cron-based checks.
-- Returns TRUE if any CRITICAL issues are found
SELECT has_critical_alerts();
Schedule it every few minutes. If it returns TRUE, trigger an alert. No parsing output. No dashboards required. This directly answers one of the most common DBA questions: how to automate Postgres health checks reliably or alerts fire before Sev-1 incidents occur, not after.
Example:
What’s New in Version 2.0
Version 2.0 doesn’t just change how checks are delivered it significantly expands what’s covered.
Built-in PostgreSQL Security Audit
Security is a non-negotiable part of any serious PostgreSQL health check. The new release includes an integrated PostgreSQL security audit focused on role-based access control and common misconfigurations.
The report now performs automated Postgres security role auditing, including:
Superuser Detection – Identify roles with unrestricted privileges
Privilege Escalation Risks – Detect roles that can
CREATE ROLEorCREATE DATABASEPassword Policy Gaps – Flag non-expiring passwords
Public Schema Exposure – Check for overly permissive
publicschema access
These are the exact issues that tend to surface after not before security incidents.
Partitioning Health Checks
For large-scale systems, proper Postgres partition management is critical and often overlooked. Version 2.0 automatically detects:
Unmatched Rows – Data that doesn’t belong to any partition
Detached Partitions – Tables that exist but aren’t attached
Strategy Validation – Verifies correct use of RANGE, LIST, or HASH partitioning
These checks help prevent silent performance degradation that creeps in over time.
Transaction & Replication Monitoring
Some of the most dangerous PostgreSQL failures are the quiet ones. Version 2.0 introduces XID wraparound monitoring, helping you catch transaction ID exhaustion before it becomes catastrophic.
We’ve also added a Postgres replication lag check, giving you real-time insight into whether replicas are keeping up and whether your high-availability setup actually works when you need it.
JSONB Gin Index Detection
This query detects JSONB columns that are missing GIN indexes - it’s a PostgreSQL performance trap detector.
How to Upgrade
If you’re currently using the legacy standalone script, upgrading is straightforward:
Download
install_health_report_function.sql

(If you haven’t downloaded it yet, the link is provided below)
Connect using psql, pgAdmin, or DBeaver
Execute the installation script
That’s it. Your database now includes a persistent, automation-ready health monitoring engine.
Example DBA Workflow
-- 1. View only critical issues
SELECT * FROM health_critical;

-- 2. Review overall health scoring
SELECT * FROM health_score;

-- 3. Investigate specific alerts
SELECT * FROM health_alerts WHERE severity = 'CRITICAL';
Take Control of Your PostgreSQL Environment Today
Stop reacting. Start preventing. Upgrade to PostgreSQL Health Report v2.0 and make database observability automatic, reliable, and actionable.
Price: $29 – Includes 2 Files: 👉 [Buy the Updated PostgreSQL Health Report]
Stored Function + Views (automate monitoring)
Standalone SQL script (one-time report)
Why $29 Is Worth Every Penny
You might be asking: Why pay $29 for a SQL file? Aren’t scripts free?
A few months ago, a PostgreSQL cluster I monitored silently hit a Sev-1. Autovacuum stopped, replication lag spiked, and the team didn’t notice until queries failed. Hours of downtime and thousands of dollars lost.
This is why PostgreSQL Health Report v2.0 exists:
Runs inside your database with stored functions & views
Immediate visibility into 70+ critical metrics
Automate alerts for Sev-1 prevention
Integrates with cron, Nagios, Zabbix, Datadog
$29 isn’t for a script. It’s insurance against downtime, lost revenue, and late-night firefighting. Prevent one incident, and it pays for itself many times over.
Who This Is For
DBAs managing production clusters
Database Architects, Developers troubleshooting slow or unstable apps
DevOps engineers automating database monitoring pipelines
Site Reliability Engineers (SREs) responsible for database uptime
Anyone who manages PostgreSQL Production environments
Final Thoughts
Database monitoring shouldn’t depend on tribal knowledge, manual scripts, or last-minute heroics during incidents. With this major update, the PostgreSQL Health Report moves from ad-hoc checks to continuous, automated Postgres database monitoring.
By combining stored functions, views, and alert-friendly outputs, Version 2.0 turns routine PostgreSQL health checks into proactive observability exactly what you want before the next Sev-1.



Solid upgrade path from manual scripts to stored functions. The has_critical_alerts() boolean is really clever for intgration with monitoring stacks, way simpler than parsing text output in cron jobs. I've dealt with similiar alerting gaps where teams were running healthchecks but not actually catching issues before they escalated. The fact that it surfaces XID wraparound and replication lag preemptively is the big value add here.