
PostgreSQL at 100% CPU with Normal Query Load: The $2M Lesson in Stale
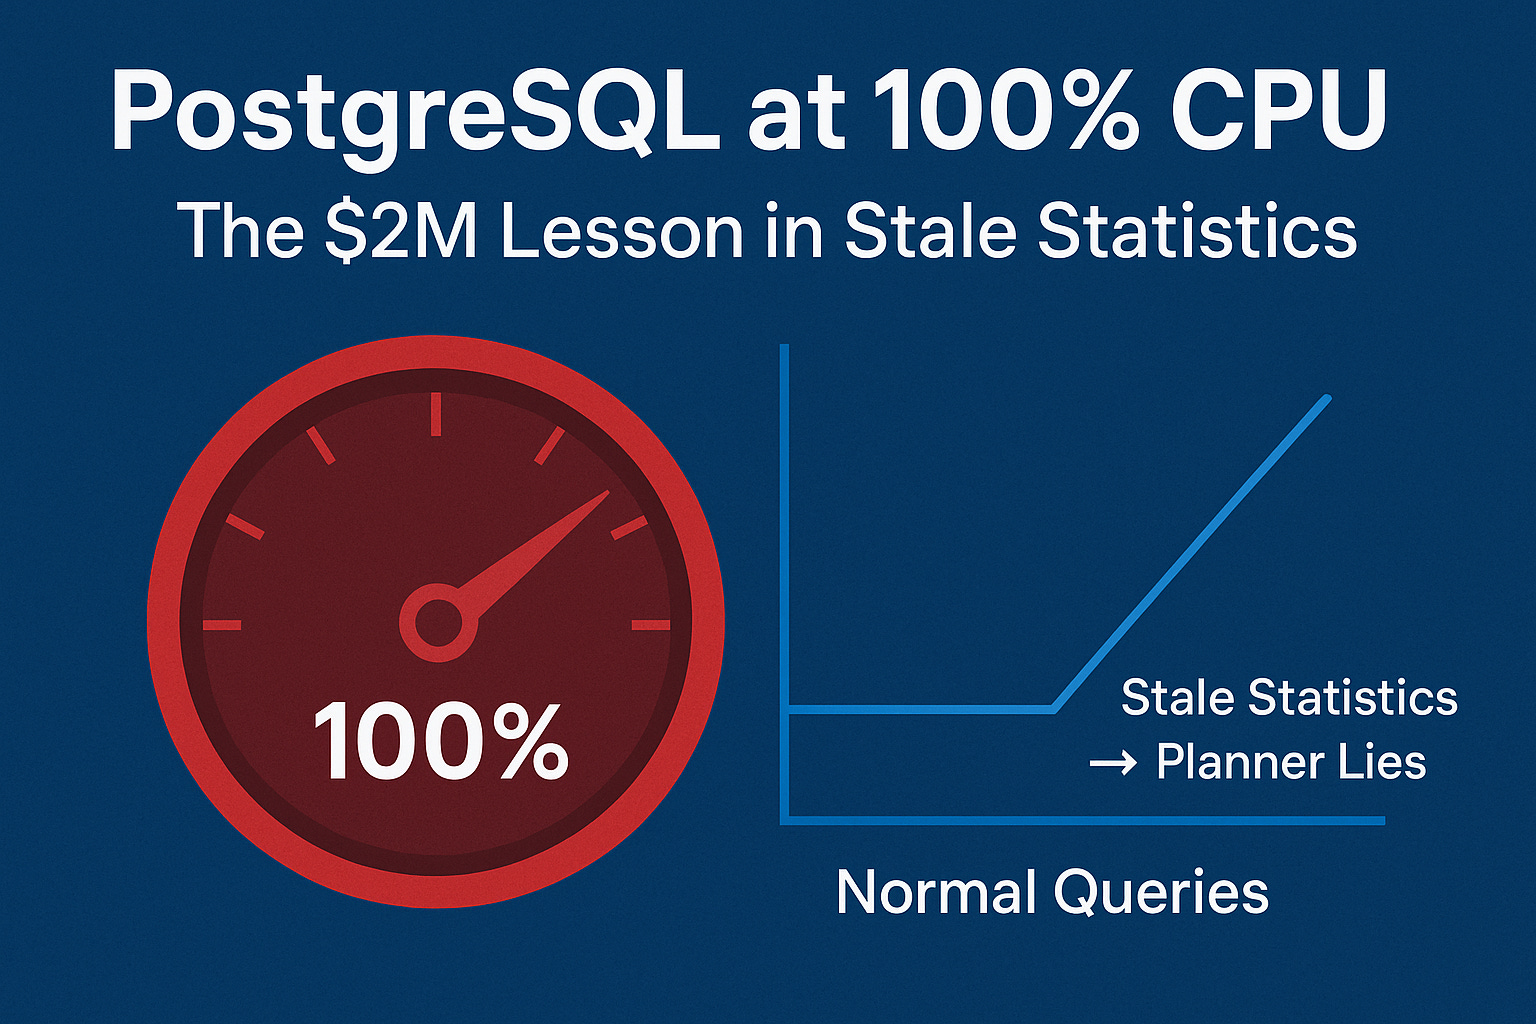
Normal queries. 100% CPU. PostgreSQL’s stale statistics misled the planner costing $2M every 10 minutes.

Friday night.
A Fortune 100 e-commerce platform was running its biggest campaign of the quarter.
Orders were steady. Query volume normal.
Yet dashboards suddenly lit up red: CPU 100% across all PostgreSQL nodes.
Cart and checkout latency jumped from milliseconds to 6 seconds.
And every 10 minutes of slowdown was costing over $2 million in lost sales.
No query storms.
No deadlocks.
No high number of connections.
So what happened?
First, Understand the Business Impact Before Touching the Database
The fastest way to diagnose incidents under pressure is to anchor yourself to the business cost.
Because the higher the cost per minute, the faster you must execute the right mitigation not just any mitigation.
You know that feeling when production breaks and you don’t know where to start?
The Checklist Mindset Playbook for Managing Sev-1 Cases
This includes:
A proven incident-handling mental model
How to think clearly under pressure
How to avoid panic debugging
Get 25+ practical SQL queries.
If you manage production systems, this playbook will change how you operate.
After resolving 1000+ Sev-1 incidents for Fortune 100 customers at Microsoft, I rely on one checklist mindset that never fails and you can get it from here.
Price 39$
🚀 Discover the new PostgreSQL Health Report one SQL file to diagnose Sev-1 incidents in minutes and fix them fast!
Price 29$
Every 10 Minutes = $2M Burn Rate
In cloud-scale systems, performance degradation isn’t just latency it’s money leaking in real time.
When PostgreSQL misjudges its execution plans:
Compute autoscaling kicks in
Queries do more work per execution
Queues back up
Downstream systems start timing out
Replication falls behind
This real-world financial model revealed:
10 minutes of degraded CPU efficiency → $2 million loss
Query latency blew up from 120 ms → 6 seconds
Replication lag crossed 18 minutes, triggering failover alarms
All while query volume stayed normal.
Let’s go step by step to solve this…
Step 1: Don’t Trust the First Narrative
When you see 100% CPU with normal query counts, the default instincts usually go like this:
Traffic surge? — Nope, query per second (QPS) is stable.
Bad query or missing index? — Plans look consistent, no new deployments.
Locks or waits? — pg_locks is quiet.
So what’s left?
If you’ve been in PostgreSQL long enough, you know the planner is both brilliant and dangerous when it has stale information.
The next question that must pop into your head:
Is PostgreSQL guessing wrong about how much data it needs to touch?
That one mental shift changes everything.
For less than the cost of two coffees a month, you’ll gain the knowledge that prevents six-figure outages and protects your sleep.
Step 2: Think Like the Planner
The PostgreSQL planner doesn’t know. It guesses based on statistics.
And those stats might be days out of date if your autovacuum isn’t tuned or if bulk updates quietly happened in the background.
When the planner thinks a table has 10 rows but reality holds 10 million, it can pick a nested loop instead of a hash join, or scan an entire table instead of using an index.
Result?
CPU spikes.
Caches thrashed.
Executors doing 100x more work per query all while your dashboards show normal QPS.
Step 3: Ask the Right Question
Not what changed in traffic, but:
When did PostgreSQL last learn the truth about this table?
Run this:
SELECT schemaname,
       relname,
       n_live_tup,
       last_analyze,
       last_autoanalyze
FROM pg_stat_all_tables
WHERE last_analyze IS NULL
   OR last_autoanalyze IS NULL
   OR now() - GREATEST(last_analyze, last_autoanalyze) > interval ‘1 day’
ORDER BY n_live_tup DESC;
1000+ incidents.
70% Sev1.
Fortune 100 pressure.
One mindset that works every time.
Price 39$
🚀 Discover the new PostgreSQL Health Report one SQL file to diagnose Sev-1 incidents in minutes and fix them fast!
Price 29$
Why this matters
This view is your stats freshness monitor.
If last_analyze or last_autoanalyze is stale, PostgreSQL’s planner is flying blind.
n_live_tuptells you estimated row counts (what planner thinks).last_analyzeshows when stats were last refreshed.last_autoanalyzeshows if autovacuum is doing its job.
If you see large tables with old stats you’ve likely found your CPU culprit.
Step 4: Correct the Guess
You don’t fix stale stats by rebooting or vacuuming everything.
You fix the data the planner depends on.
ANALYZE your_table;ANALYZE command rebuilds the table’s statistical histogram and MCV (most common value) lists, restoring accurate planner estimates.
CPU load will often drop within seconds of this command.
For high-velocity tables (e.g., orders, events, sessions), the default autovacuum thresholds are too lazy.
You can force more frequent auto-analyze like this:
ALTER TABLE your_table
SET (autovacuum_analyze_scale_factor = 0.005);
For less than the cost of two coffees a month, you’ll gain the knowledge that prevents six-figure outages and protects your sleep.
Why it matters:
By default, PostgreSQL waits until 10% of rows change before analyzing.
That’s fine for archival data, but bad for real-time workloads.
A 0.5% threshold ensures frequent planner updates.
If your workload has highly skewed columns (like status, region, or category), improve the histogram depth:
ALTER TABLE your_table ALTER COLUMN status SET STATISTICS 500;The planner uses column stats to guess selectivity.
Richer histograms = better cardinality estimates = fewer bad plan choices.
Note:
You should use this specific command and low value (0.005) for high-velocity, volatile tables (e.g., sessions, logs, or primary transaction tables) where statistical drift is a known or likely problem.
The default scale factor is 0.1 (10%).
By setting it to 0.005, you instruct PostgreSQL to perform an automatic
ANALYZEoperation when only 0.5% of the rows inyour_tablehave been inserted, updated, or deleted.
This ensures the Query Planner gets fresh data frequently, preventing the kind of disastrous plan changes that lead to sudden high CPU utilization even when query volume is normal.
Step 5: Prevention Mindset
You can’t afford to hope autovacuum catches up. You have to design for stats freshness.
Checklist:
Set
autovacuum_analyze_scale_factorto 0.005–0.01 for hot tables.Use
pg_stat_all_tablesor monitoring dashboards to tracklast_autoanalyzelag.Periodically
ANALYZElarge partitioned tables after bulk loads.Watch for tables where
n_dead_tupgrows faster thanvacuum_count.
When the CPU suddenly spikes but queries don’t, ask yourself:
Is PostgreSQL guessing wrong again?
Key Takeaway
When CPU spikes without a query surge, don’t chase ghosts.
Ask one question first:
Is PostgreSQL guessing wrong?
Want the Deep Stuff? Become a Paid Member
Paid members get instant access to:
Premium content with Deep dive into full RCA analysis, get actionable scripts, and Ask Me Anything via Email for Mentorship for 8$/month.