
Why Your PostgreSQL Query Is Slow: The 7 Checks I Run During Every Sev-1
Step-by-step PostgreSQL query optimization and performance tuning for production systems

When money is bleeding, I don’t run theory. I run these same 7 checks every single time.
If you’re responsible for PostgreSQL performance tuning, even a single slow query can cripple your system in seconds. This guide shows exactly how to optimize PostgreSQL performance and improve query performance PostgreSQL.
📑 Table of Contents
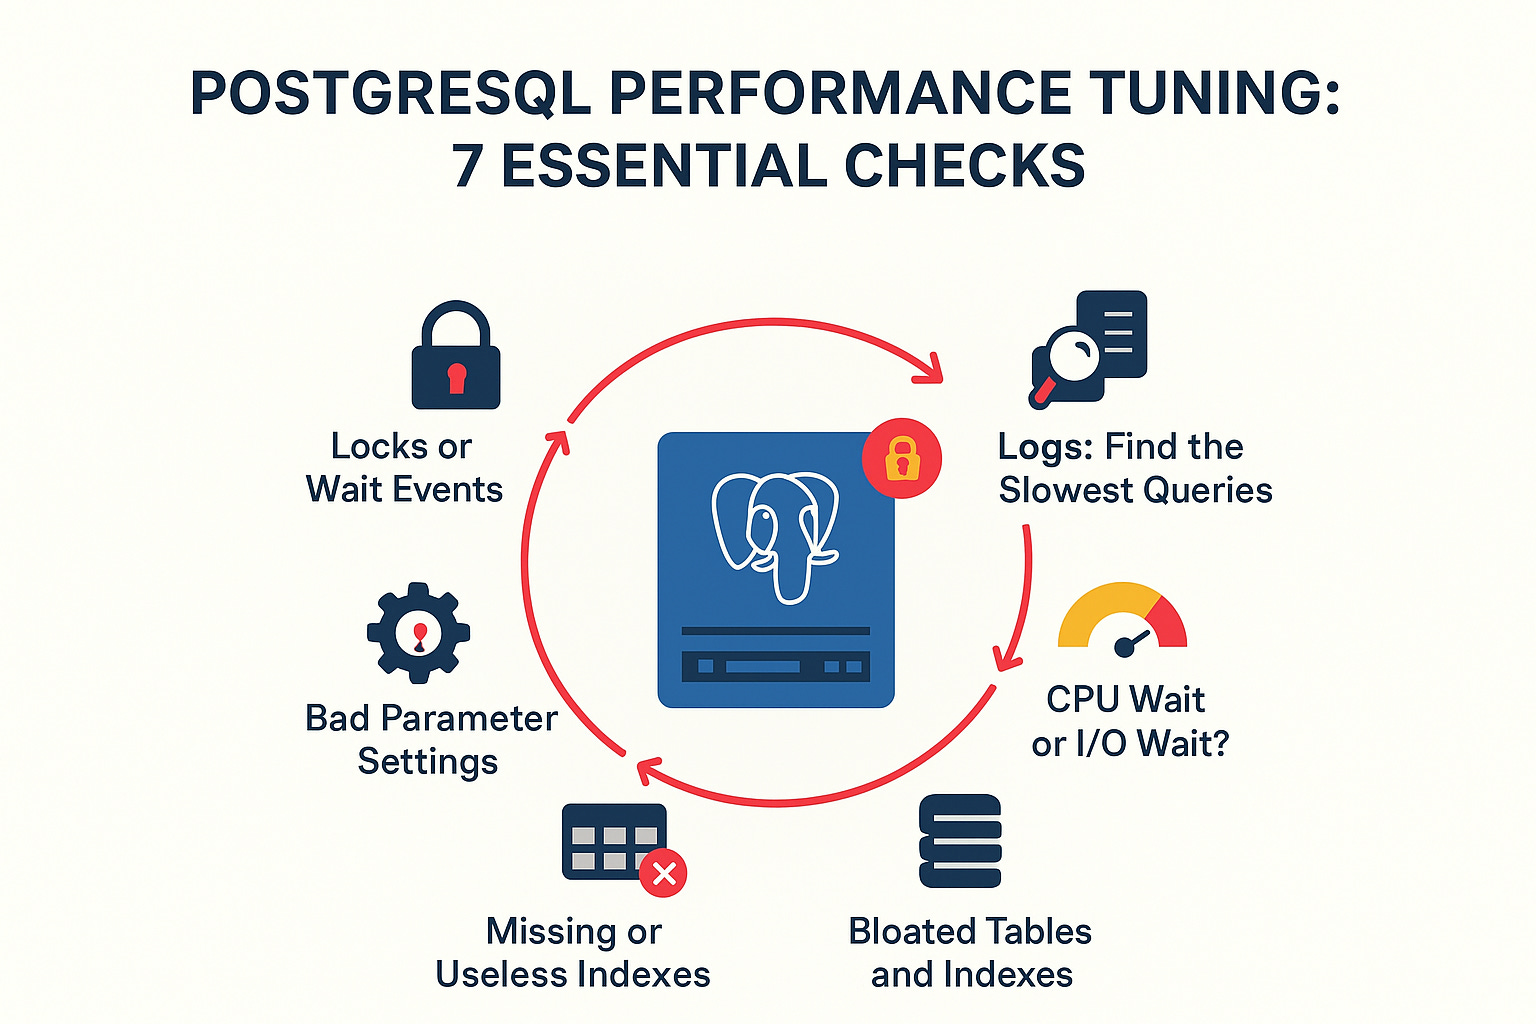
Check 1 — Logs: Find the Slowest Queries
Check 2 — CPU Wait or I/O Wait?
Check 3 — Bloated Tables and Indexes
Check 4 — Missing or Useless Indexes
Check 5 — Bad Parameter Settings
Check 6 — Locks or Wait Events
Want a Complete PostgreSQL Health Report with one query?
Why Slow Queries Happen (Real Causes You See in Production)
Sudden data spikes: A deployment causes 10M+ rows to be returned unexpectedly.
Stale stats: The planner guesses wrong because stats are outdated.
Missing or incorrect indexes: Queries suddenly take 10x longer.
Too many connections at once: The server starts thrashing.
Locks and waits: Queries get stuck waiting for each other.
Storage issues: Disk I/O slows everything down.
Knowing these patterns is half the battle. The other half is actually seeing which queries are slow right now.
What if you could detect slow queries in one click instead of digging through logs for an hour?
I built exactly that.
Price: $29 – Includes 2 Files: 👉 [Buy the Updated PostgreSQL Health Report Detect Slow Queries]
Step 1 Are You Tracking Your Queries?
Before you troubleshoot, you need to know if PostgreSQL is tracking query performance at all.
If pg_stat_statements is not enabled, you won’t be able to monitor query performance effectively. This extension is the built-in tool for identifying queries that are taking longer to execute.
Here’s a safe snippet you can run:
SELECT
    extname AS extension,
    CASE
        WHEN extname = 'pg_stat_statements' THEN 'ENABLED'
        ELSE 'DISABLED'
    END AS status
FROM pg_extension
WHERE extname = 'pg_stat_statements';
If it’s disabled, enable it, as your system relies on slow query logging for query performance tuning.
Important Note: Keep in mind that enabling it during periods of high traffic or server load may cause performance degradation.
However, this extension is essential for finding the source of truth and will guide you find:
Slowest queries
Queries consuming the most execution time
Spikes and outliers
Call counts and averages
Step 2 See Which Queries Are Actually Slow
Quick Preview Query:
Once you know tracking is on, you can check which queries are slow. Here’s a sample, safe snippet:
SELECT
    query,
    calls,
    total_exec_time,
    mean_exec_time,
    max_exec_time
FROM pg_stat_statements
ORDER BY mean_exec_time DESC
LIMIT 10;
This gives you:
Top 10 slowest queries
Their mean & max execution time
Total time consumed
Number of calls
This is enough to start troubleshooting fast.
But this is not enough for production-grade analysis.
Because in real Sev-1 incidents, you need to know:
which slow queries are hogging 80% of CPU
which ones cause lock chains
which ones have cardinality mismatch
which ones deteriorate after vacuum
which ones explode in response time under concurrency
which ones require index fixes
which ones have I/O vs CPU bottlenecks
This is what most teams miss.
Shortlist the Kill Zones (Queries Causing 80% of the Damage)
When you get slow query data, focus on these:
1. Queries with high total_exec_time
These are burning your system.
2. Queries with huge mean_exec_time
These are unstable and unpredictable.
3. Queries with very large max_exec_time spikes
These cause intermittent outages.
4. Queries with many calls but small indexes
These usually need composite indexing.
5. Queries that always show up in your top 10
These are your permanent sources of truth.
Step 3 CPU Wait or I/O Wait?
The real cause of slowness is often hidden in CPU-bound queries or disk-bound queries.
SELECT pid, wait_event_type, wait_event, state, query
FROM pg_stat_activity
WHERE state = 'active';
Use pg_stat_io or node monitoring to differentiate CPU-intensive vs I/O-heavy queries.
This helps pinpoint performance bottlenecks and guide your query optimization strategy.
Step 4 Bloated Tables and Indexes
Bloated tables and indexes kill the optimizer. Check for:
Dead tuples
Fragmented pages
Table scans that shouldn’t happen
Command examples:
SELECT * FROM pg_stat_all_tables;
SELECT * FROM pg_stat_all_indexes;
Excessive bloat increases query execution time, making performance unpredictable. Ensure autovacuum is properly configured and consider VACUUM / ANALYZE to maintain healthy statistics.
Want more in depth queries? Check this article
Step 5 Missing or Useless Indexes
Indexes are the heart of query performance. Look for:
Missing or wrong indexes → check WHERE, JOIN, ORDER BY, GROUP BY
Wrong index types (GIN vs B-tree, Hash vs B-tree)
Bad statistics → run
ANALYZE;Wrong join order → planner misestimation
I/O bottlenecks → disk latency kills queries
Use EXPLAIN (ANALYZE, BUFFERS) to verify query plans vs actual execution:
EXPLAIN (ANALYZE, BUFFERS)
SELECT * FROM orders WHERE customer_id = 123;
This helps you identify bottlenecks, allowing you to optimize PostgreSQL queries.
Look for:
sequential scans
misused indexes
nested loops gone wrong
sort operations spilling to disk
bitmap heap scans with too many heap fetches
high shared read/write buffers
This is where 90% of slowness is exposed.
Expectation vs Reality
You check the plan with EXPLAIN, just to see what PostgreSQL thinks it will do:
EXPLAIN → Planner’s guess (safe, estimates only)
EXPLAIN ANALYZE → Reality check (runs the query, shows actual rows, time, buffers)
Step 6 Bad Parameter Settings
Misconfigured settings can cripple query performance:
work_mem too low → queries spill to disk
shared_buffers too small → more I/O than needed
maintenance_work_mem → affects VACUUM & ANALYZE
Making these adjustments enhances PostgreSQL performance tuning and helps prevent long-running or resource-intensive queries from blocking the system.
Here, I have provided a more detailed explanation about these parameters. If they are not properly configured, they could lead to your next outage.
Step 7 Locks or Wait Events
Lock contention can make a normally fast query painfully slow:
SELECT * FROM pg_stat_activity WHERE wait_event IS NOT NULL;
Focus on queries waiting on:
Row locks
Advisory locks
Deadlocks
Resolving lock issues directly improves PostgreSQL database performance tuning and overall Postgres health.
Looking for a more powerful query with clearer results? Take a look at this:
How to Fix the Top 3 Instantly
Kill or optimize the top slow queries (Check 1)
Add missing indexes (Check 4)
Resolve lock chains or high I/O queries (Check 2 + 6)
These three actions alone can stop production bleeding in minutes.
7. Want the Complete Diagnostic Script?
Everything above is just 7 of 60+ checks I run during production incidents.
Running these checks manually during a Sev-1 is slow and error-prone. You’re Googling queries, copying from Stack Overflow, forgetting edge cases.
That’s why I built the PostgreSQL Sev-1 Toolkit.
It’s a single 1,000+ line SQL script you copy-paste into any PostgreSQL client. In 30 seconds, you get:
✅ Slow query analysis Top queries by total time, mean time, percentage breakdown
✅ Blocking query detection Full blocker chain with kill commands
✅ Missing index detection Tables with high sequential scans, severity rated
✅ Unused index detection Wasted indexes with DROP commands
✅ Table bloat analysis Dead tuple percentages with VACUUM commands
✅ Wait event breakdown I/O vs. lock vs. CPU analysis
✅ Cache hit ratio Overall and per-table performance
✅ Autovacuum health Is maintenance keeping up?
✅ Connection pool health
✅ Replication lag If you’re running replicas
✅ And 30+ more checks
Works on: PostgreSQL 12+, Azure, AWS RDS, Aurora, GCP Cloud SQL, Supabase, self-hosted
What You Get:
📄 The Complete Diagnostic Script (1,000+ lines, 70+ checks)
📋 Quick Reference Cheatsheet (PDF) What each alert means, healthy thresholds
Includes 2 Files:
Stored Function + Views (automate monitoring)
Standalone SQL script (one-time report)
$29. One script. 30-second diagnosis. Auto-generated fix commands.
Thank you for reading. If you found this helpful, please consider restacking and sharing with your network to support goal of growing the community.