
[FREE] Why Query Performance Degrades and Causes High CPU
Stale Statistics, Reset Stats, and Missing ANALYZE: The Hidden Causes Behind Query Plan Regressions

The Pattern I Keep Seeing
Sev-1 declared. CPU at 100%. Queries timing out.
You check pg_stat_activity. One query running thousands of times. Each execution taking 10x longer than yesterday.
You run EXPLAIN ANALYZE. The plan changed.
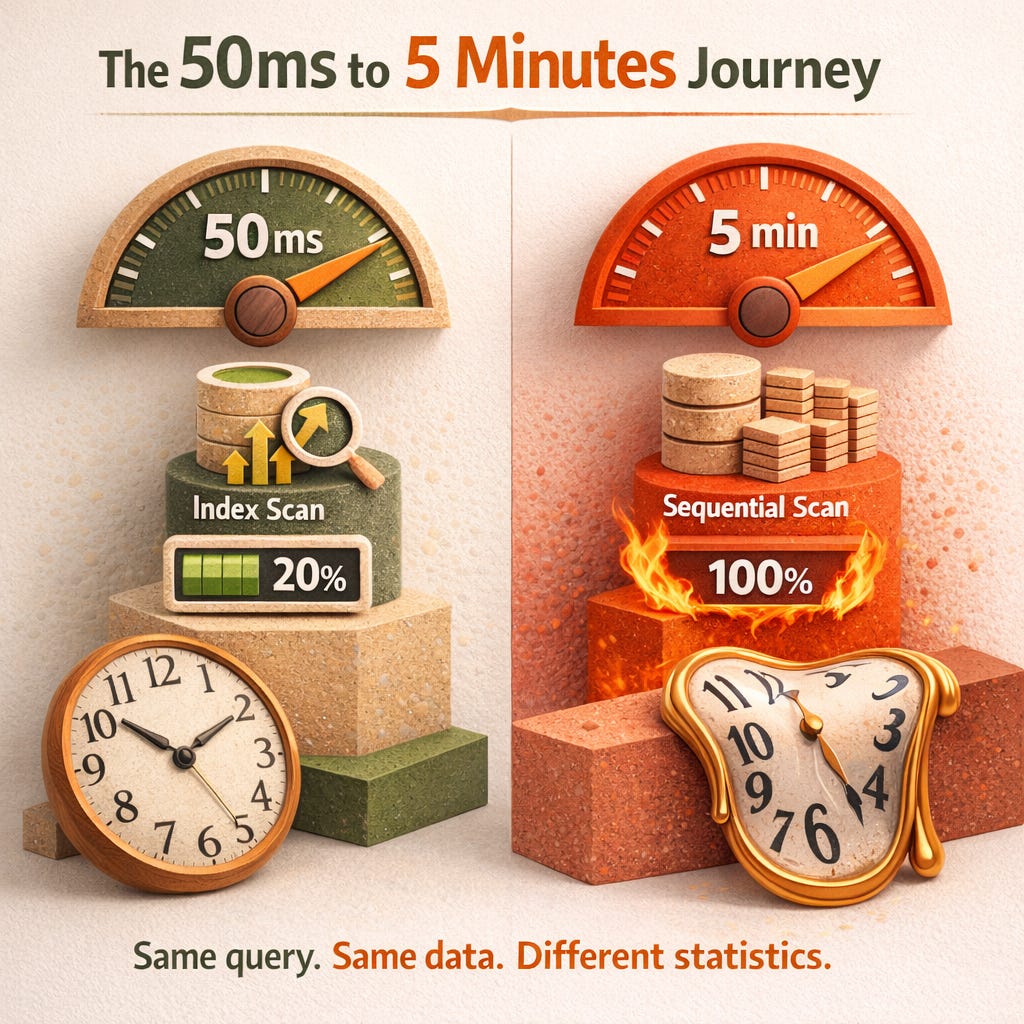
Yesterday: Index scan, 50ms.
Today: Sequential scan, 5 minutes.
Nothing in the code changed. No deployment. No config change.
What changed: Statistics.
Either they got stale, they got reset, or autovacuum never collected them in the first place.
The PostgreSQL manual is explicit about this:
It is important to have reasonably accurate statistics, otherwise poor choices of plans might degrade database performance.
Degrade is an understatement. I’ve seen stale stats take down production.
Table of Contents
Stats Reset Trap
Autovacuum’s Blind Spot
Partitioned Tables: Silent Killer
Foreign Tables: Zero Stats by Default
Per-Column Tuning for Skewed Data
Diagnostic Queries
Quick Reference: What Autovacuum Misses
What the Manual Recommends
References
Stats Reset Trap
This one hits after major version upgrades, pg_upgrade, or pg_restore.
Statistics don’t always survive. Your tables have data, but pg_statistic is empty or stale.
The planner sees a table with 10 million rows but estimates 1,000. It chooses a nested loop instead of a hash join. CPU explodes.
Fix: Always run ANALYZE after restore or upgrade:
ANALYZE;The PostgreSQL manual is explicit about this:
ANALYZE uses a statistically random sampling of the rows of a table rather than reading every single row. In practice, it is usually best to just analyze the entire database, because it is a fast operation.
Autovacuum’s Blind Spot
Most teams assume autovacuum handles statistics. It does partially.
The manual warns:
The daemon schedules ANALYZE strictly as a function of the number of rows inserted or updated; it has no knowledge of whether that will lead to meaningful statistical changes.
What this means:
Your table has 1 million rows. You update 100,000 of them. Autovacuum runs ANALYZE.
But what if those updates didn’t change the data distribution? Wasted work.
What if only 1,000 rows changed, but they shifted the distribution dramatically? No ANALYZE triggers.
Sev-1 scenario:
A batch job updates timestamps on old rows. Row count change is small. Autovacuum doesn’t trigger.
But the WHERE created_at > now() - interval ‘7 days’ query now has completely wrong estimates.
The planner thinks 10 rows. Reality: 500,000 rows.
Sequential scan. Full table. CPU at 100%.
The manual’s rule of thumb:
Think about how much the minimum and maximum values of the columns in the table change. A timestamp column that contains the time of row update will have a constantly-increasing maximum value... such a column will probably need more frequent statistics updates.
Partitioned Tables: Silent Killer
This one catches teams who migrated to partitioning for performance.
The manual is explicit:
Tuples changed in partitions and inheritance children do not trigger analyze on the parent table. If the parent table is empty or rarely changed, it may never be processed by autovacuum, and the statistics for the inheritance tree as a whole won’t be collected.
Sev-1 scenario:
You partition a 500GB table by date. Data flows into child partitions daily.
Autovacuum runs ANALYZE on the children. Never on the parent.
Queries against the parent table use garbage estimates. Plans degrade over weeks until someone notices.
Fix from the manual:
It is necessary to run ANALYZE on the parent table manually in order to keep the statistics up to date.
ANALYZE partitioned_parent_table;Schedule this weekly or daily depending on data velocity.
Foreign Tables: Zero Stats by Default
If you use postgres_fdw, file_fdw, or any foreign data wrapper:
The autovacuum daemon does not issue ANALYZE commands for foreign tables, since it has no means of determining how often that might be useful.
Sev-1 scenario:
You join a local table with a foreign table. The planner has no idea the foreign table has 50 million rows. It estimates 1,000.
It chooses a nested loop join. Each row in the local table triggers a foreign query.
Timeout. Sev-1.
Fix:
If your queries require statistics on foreign tables for proper planning, it’s a good idea to run manually-managed ANALYZE commands on those tables on a suitable schedule.
ANALYZE foreign_table_name;Per-Column Tuning for Skewed Data
Some columns have wildly uneven distributions. The default statistics target (100 histogram buckets) isn’t enough.
The manual:
Columns that are heavily used in WHERE clauses and have highly irregular data distributions might require a finer-grain data histogram than other columns.
Sev-1 scenario:
A status column has 99% of rows as completed and 1% as pending.
With default statistics, the planner can’t distinguish WHERE status = pending (returns 10,000 rows) from WHERE status = completed (returns 1 million rows).
Both get the same estimate. One gets a terrible plan.
Fix:
ALTER TABLE orders
ALTER COLUMN status SET STATISTICS 1000;
ANALYZE orders;
Range is 0 to 10000. Higher = more buckets = better estimates for skewed data.
Diagnostic Queries
Find tables with stale statistics:
SELECT
    schemaname,
    relname,
    last_analyze,
    last_autoanalyze,
    n_live_tup,
    n_mod_since_analyze
FROM pg_stat_user_tables
WHERE n_mod_since_analyze > n_live_tup * 0.1
OR last_analyze IS NULL
ORDER BY n_mod_since_analyze DESC
LIMIT 20;
Tables where >10% of rows changed since last ANALYZE, or never analyzed.
Find partitioned parents that may need manual ANALYZE:
SELECT
    c.relname AS parent_table,
    pg_stat_get_last_analyze_time(c.oid) AS last_analyze
FROM pg_class c
JOIN pg_partitioned_table pt ON c.oid = pt.partrelid
WHERE pg_stat_get_last_analyze_time(c.oid) IS NULL
OR pg_stat_get_last_analyze_time(c.oid) < now() - interval ‘7 days’;
Check per-column statistics targets:
SELECT
    c.relname AS table_name,
    a.attname AS column_name,
    a.attstattarget AS statistics_target
FROM pg_attribute a
JOIN pg_class c ON a.attrelid = c.oid
JOIN pg_namespace n ON c.relnamespace = n.oid
WHERE a.attstattarget != -1
AND a.attstattarget != 0
AND n.nspname NOT IN (’pg_catalog’, ‘information_schema’)
ORDER BY c.relname, a.attname;
🚀 The PostgreSQL Health Report already includes stale statistics detection.
One SQL function that checks:
→ Tables never analyzed (query planner has no statistics)
→ Tables with stale statistics (>20% modification since last ANALYZE)
→ High modification counts with staleness percentage
→ Generates ready-to-run ANALYZE commands
Plus 60+ other diagnostic checks in a single run.
Quick Reference: What Autovacuum Misses
Auto-analyzed:
→ Regular tables with sufficient row changes
NOT auto-analyzed:
→ Partitioned parent tables
→ Inheritance parent tables
→ Foreign tables
→ Tables where distribution changed but row count didn’t
What the Manual Recommends
1. Run ANALYZE after restore/upgrade — Statistics may not survive
2. Schedule manual ANALYZE on partitioned parents — Children don’t trigger parent analysis
3. Schedule manual ANALYZE on foreign tables — Autovacuum can’t help
4. Increase statistics target for skewed columns — Default 100 buckets isn’t always enough
5. Think about distribution, not just row count — Autovacuum only tracks row changes
References
PostgreSQL Manual: Updating Planner Statistics
📧 Want the complete Health Report?
Includes statistics age checks, vacuum health monitoring, and 60+ diagnostic queries that catch these issues before they become Sev-1s.
For a more detailed analysis, become a premium member and get diagnostic queries and step-by-step instructions.
8$/Month.